Research Article
Is Artificial Intelligence the Most Reliable Way to Predict Mortality After Liver Transplantation?
Marcos Bruna Esteban1*, Eva Montalvá2, Antonio J. Serrano-López3, Joan Vila-Francés3, Javier Maupoey2 and Juan Vila J2
1Department of General and Digestive Surgery, General University Hospital of Valencia, Spain
2University and Polytechnic Hospital of La Fe, Spain
3Department of Data Analysis Laboratory, School of Engineering at the University of Valencia, Spain
*Corresponding author: Marcos Bruna Esteban, Department of General and Digestive Surgery, General University Hospital of Valencia, Spain
Published: 20 Sep, 2018
Cite this article as: Esteban MB, Montalvá E, Serrano-
López AJ, Vila-Francés J, Maupoey Jm
Juan Vila J. Is Artificial Intelligence the
Most Reliable Way to Predict Mortality
After Liver Transplantation?. Clin Surg.
2018; 3: 2122.
Abstract
Introduction: Graft allocation in Liver Transplantation (LT) should be based on the greatest
survival benefit to the patients awaiting transplantation. This study developed a predictive model to
determine recipient mortality 1 year after LT.
Materials and Methods: We developed Artificial Neural Network (ANN) and Logistic Regression
(LR) models and compared their results with the Balance of Risk (BAR), Survival Outcomes
Following Transplantation (SOFT), and Model for End-stage Liver Disease (MELD) scores. The
Development Group used to create the predictive models included 1235 valid cases, while 200
consecutive transplant patients since January 2009 were included in the Generalization Group for
internal validation.
Results: The area under the curve (AUC) of the ANN model (0.82) was higher than that of the LR
model (0.68). For the Generalization Group, the MELD, SOFT, and BAR scores had AUCs of 0.56,
0.57, and 0.62, respectively. The ANN model had a significantly higher AUC than that of each score
(MELD, p=0.005; SOFT, p=0.009; BAR, p=0.02).
Conclusion: ANN model was superior to the LR model and other scales currently used to predict
mortality during the first year after LT and to match a particular graft with potential recipients.
Keywords: Artificial Intelligence; Liver Transplantation; Recipient Survival; Waitlist Management
Abbreviations
ANN: Artificial Neural Network; AUC: Area Under the Curve; BAR: Balance of Risk; DRI: Donor Risk Index; HBV: Hepatitis B Virus; HCV: Hepatitis C Virus; IQR: Interquartile Range; LR: Logistic Regression; LT: Liver Transplantation; MELD: Model for End-Stage Liver Disease; NPV: Negative Predictive Value; PPV: Positive Predictive Value; SOFT: Survival Outcomes Following Transplantation
Introduction
Liver Transplantation (LT) has improved markedly and recipient survival has increased progressively [1], with survival rates close to 90% 1 year after transplantation [2]. Although Spain has the highest organ donation rates in the world [3], the supply remains insufficient due to the growing demand and increased number of patients on the waiting list. Therefore, it is necessary to construct predictive mortality and allocation models to increase the efficiency of this process. Data that allow us to predict the expected survival with a specific graft is a very important step in selecting the best recipient in each case [4]. Although many risk scales and predictive models based on a large number of cases and years of experience and follow-up have demonstrated relationships between different variables and liver recipient mortality, none of them constitute a universal model able to predict the result. However, there is evidence that the addition of many risk factors increases the possibility of a worse post-transplant outcome [5]. Therefore, this study developed a predictive model to determine recipient mortality 1 year after LT, based on known preoperative donor, recipient, and graft variables. For this purpose, we developed Artificial Neural Network (ANN) And Logistic Regression (LR) models and compared their results with other predictive scores.
Figure 1
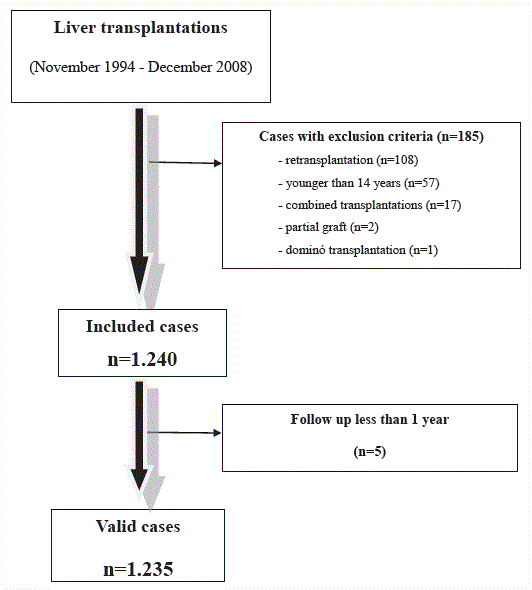
Figure 1
Flowchart of included cases in the Development group.
Materials and Methods
This was a retrospective, descriptive, analytical study of data
collected prospectively from a cohort of 1235 adult hepatic recipients
followed for the first year after transplantation. Using defined
recipient, donor, and graft variables known before transplantation,
this cohort was used to develop two predictive models of recipient
[5] mortality 1 year after LT: one based on LR and the other based
on ANN. The study was approved by the local research ethics
committee. To create predictive models, we included all patients
undergoing orthotopic LT in the Hepatobilio pancreatic Surgery and
Transplantation Unit of the Hospital Universitario y Politécnico La
Fe (Valencia-Spain), from November 1994 to December 2008 in the
Development Group. We excluded patients younger than 14 years
and recipients of a partial liver graft or a graft from a non-heartbeating
donor, domino transplantation, combined transplantation,
or retransplantation, and recipients followed for less than 1 year
(Figure 1). We applied these predictive models to a population
of 200 consecutive patients transplanted in the same unit since
January 2009 (Generalization Group), using the same inclusion and
exclusion criteria. We considered recipient mortality related to the
procedure in the following situations: surgical complications, graft
dysfunction, recurrence of primary disease or complications due to
immunosuppressive therapy.
We used data for 29 variables to create the predictive models
(Table 1). A univariate, descriptive, comparative analysis was used
to compare the Development and Generalization Groups, using the
t-test for independent samples for continuous variables and the chisquare
test for qualitative variables. The statistical analysis and LR
model were performed using SPSS® ver.20.0 for Windows, including
all variables that were selected in the study and using a sequential
withdrawal procedure based on the likelihood ratio. MATLAB®
ver.2010 was used to develop the predictive model based on the ANN,
consisting of a multilayer perceptron with forward connections and
supervised learning. To maximize the information [6] available
to develop and compare predictive models, missing values in the
Development Group were completed using the hot-deck 6 pairing
method, filling incomplete cases using the values for the most similar
cases in our database. The predictive capacity of the model was
assessed using the area under the receiver operating characteristics
curve (AUC). Finally, the probability thresholds of the predictive
models were determined by a multidisciplinary team to maximize
their value, to improve the allocation efficiency and transplantation
results. For this purpose, utility values were assigned for each test
result (Table 2), establishing the maximum value for the prediction
of recipient mortality. All other values were agreed on in relation to
the maximum.
Once the LR and ANN models were created from the development
group, we applied them to the Generalization Group and analyzed
their predictive capacity. The results were evaluated by a comparative
analysis of AUC using the Hanley and McNeil test [7]. Similarly,
the Model for End-stage Liver Disease (MELD), Survival Outcomes
Following Transplantation (SOFT), and Balance of Risk (BAR) [8,9]
scores were applied to the Generalization Group and we compared
them with the created predictive models.
Figure 2
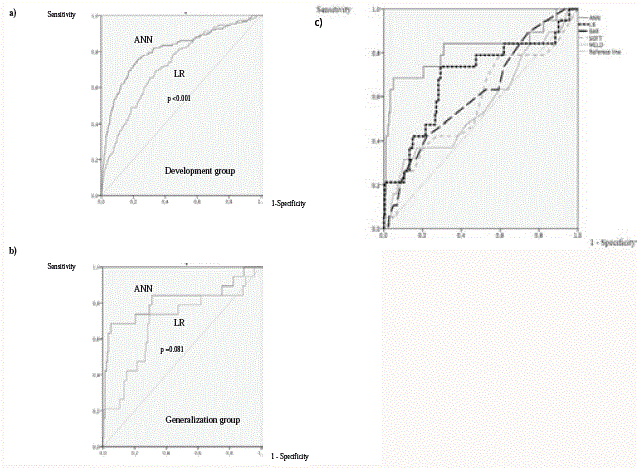
Figure 2
Comparison of AUROCs for ANN vs. LR models in the Development
group (a) and in the Generalization group (b). AUROCs for ANN and LR
models and BAR, SOFT and MELD scores in the Generalization group (c).
Figure 3
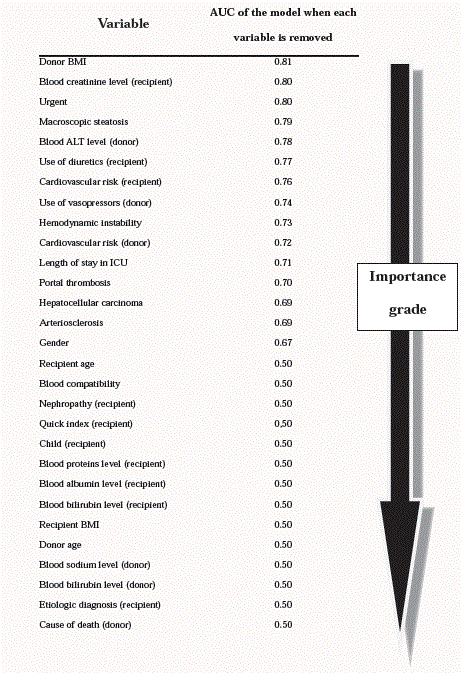
Figure 3
Importance of the variables and AUC of ANN model when we
remove each of them from the model.
Table 1
Table 1
Descriptive and comparative analysis of the variables in the Development and Generalization groups.
Table 2
Table 2
Utility values.
Table 3
Table 3
Causes of recipient mortality related to the procedure during first year
after LT in the Development and Generalization groups.
Results
From November 1994 to December 2008, 1435 transplants were
performed at our center. After applying the exclusion criteria, 1235
valid cases were included in the Development Group (Figure 1). Since
January 2009, 200 cases were included in the Generalization Group
[7]. During the first year after transplantation, 12.1% of the recipients
(150 patients) in the development group died, with a median survival
of 11 (IQR 10-12) months. In the Generalization Group, 19 patients
(9.5%) died, with a median survival of 11 (IQR 10-12) months.
The main causes of mortality were infections and recurrence of the
primary liver disease and the incidence of each were similar in both
groups (Table 3). Univariate analysis Table 4 showed that variables
significantly (p<0.05) related to recipient mortality during the year
after transplantation were donor age, recipient age, etiological
diagnosis of cirrhosis, and presence of nephropathy, hepatocellular
carcinoma and portal thrombosis in the recipient. The LR model
was obtained after 22 steps (Additional Information 1). AUC of the
LR model was 0.72 (95% CI 0.68–0.76) in the Development Group
(Figure 2) and an AUC of 0.68 (95% CI 0.54–0.82) was obtained
when we applied this model in the Generalization Group (Figure
2). For the assigned values of utility, the sensitivity, specificity, and
accuracy were 42.1, 84.5, and 80.5% respectively, with a positive
predictive value (PPV) of 22.2% and a Negative Predictive Value
(NPV) of 93.2% (Additional Information 2). The ANN model was
based on a fully connected neural network with 42 input neurons,
27 hidden neurons, and one output neuron, which gives the risk of
the recipient’s mortality during the first year after LT. The analyzed
variables had different levels of importance in the model and Figure
3 shows the AUCs of the model after removing each of them. Based
on previously defined utility values, a threshold of 0.28 (0.2 for the LR
model) was obtained to discriminate between positive and negative
tests. We applied the model created in the Development Group and
obtained an AUC of 0.81 (95% CI 0.77-80.85) (Figure 2). In the
Generalization Group (Figure 2), we obtained an AUC of 0.82 (95%
CI 0.68-0.96) and the sensitivity, specificity, and accuracy were 68.4,
86.1, and 84.5%, respectively, with a PPV of 34.2% and NPV of 96.3%
(Additional Information 3). When we compared the AUCs of the
predictive models in both groups, the ANN model was superior to
the LR model, with a statistically significant difference (p<0.001) in
the Development Group (Figure 3).
The MELD, SOFT, and BAR scores were applied in the
Generalization Group, obtaining AUCs of 0.56 (95% CI 0.41-0.71),
0.57 (95% CI 0.42-0.71), and 0.62 (95% CI 0.48–0.75), respectively.
The AUC of the ANN model was significantly higher than each of
these: MELD, p=0.005; SOFT, p=0.009; BAR, p=0.02 (Figure 2).
Table 4
Table 4
Univariate analysis.
Discussion
Artificial intelligence and models based on an ANN can give
predictive results using large databases, such as a liver transplantation
series. These models are based on the structure of the brain and they
can detect complex and, in many cases, non-linear relationships
among variables due to their plasticity. The use of functional and
hepatic status assessment scores such as MELD, SOFT, and BAR
has helped to optimize waiting list prioritization and to decrease the
short-and long-term mortality after LT. Nevertheless, about 10%
of liver recipients die within 1 year of the intervention. Therefore,
it is necessary to continue searching for a method to make graft
allocation to a specific recipient as efficient as possible [10,11]. In
this study, ANN methodology was applied to make a model that
proved to be superior at [9] predicting recipient mortality during
the first year after transplantation in comparison with a model
created with LR and other classic scores. The ANN model included
29 variables related to recipient mortality after transplantation. All
of them are easily collected during the preoperative period. Only
two of them are subjective variables: graft macroscopic steatosis and
donor atherosclerosis. However, this subjectivity is reduced because
multivisceral extraction is usually performed by surgeons with a
lot of experience, and only five surgeons in our group perform the
extraction and macroscopic evaluation of the graft and aorta in the
donor, using systematically specific protocols and scales validated by
a multidisciplinary team.
The characteristics of the liver recipients in the Developmental
Group were similar to those published in other studies and in the
European Liver Transplantation Registry [12], with a median age
of 55 years [13]. More than 60% of them were male and they had
some cardiovascular risk factors, as in other series [14]. The main
indications for transplantation were cirrhosis due to chronic
Hepatitis C Virus (HCV) infection and enolic cirrhosis [15]. Overall,
40% were classified in Child group C, as in other groups [15]. On
the other hand, the donor characteristics have changed over time.
The donors are now older, with more associated diseases and more
frequent deaths due to cerebrovascular injury [16]. Despite the fact
that the data used in these models were collected over a long period
of time, future advances in treatments and changes in the indications
and characteristics of these patients could alter the utility of these
predictive models. Our recipient survival is close to 90% 1 year after
transplantation, which is similar to published values [17]. Despite
the fact that the quality of implanted grafts has [10] been worsening,
the range of recipient survival has been maintained over time. The
variable with the greater prognostic relevance was the recipient’s liver
disease. The ages of the donor and recipient18and the causes of the
donors’ death were also important, as other studies have shown [19].
The predictive results of these models are clinically correct.
However, their sensitivity is low compared with their high specificity
(close to 90%) due to the assigned utility values, supported by the
main objective of avoiding recipient deaths. Similarly, the positive
predictive values are low in both models and the negative predictive
values exceed 90%, to create a test that does not fail to predict
recipient mortality. Consequently, when the test is positive, the best
option is not to perform the transplantation in that recipient, and
to assign the graft to another recipient with better expectations. We
noted the superior predictive capacity of the ANN model versus the
LR model and the currently used BAR, SOFT, or MELD scores. This
better performance of ANN could be justified by the characteristics of
the clinical data used and the limitations present in the LR and other
models, which are based on a small number of variables, to simplify
their applicability. In this way, an ANN can establish more complex
relationships among variables and obtain more reliable results with
large databases than models created with LR [20]. An ANN establishes
interconnections among input variables that give a result that we can
use as a risk predictor after the training and learning process.
A few publications have used this mathematical model in LT.
Briceño et al. [21] published a multicenter study with more than 1000
transplantation based on this methodology. A total of 57 variables
for each donor-recipient pair were used to create 211 predict models
than predicted probability of graft survival (AUC: 0.80) and graft
loss (AUC: 0.82) 3 months after transplantation. The end point of
our model is different: recipient survival 1 year after transplantation,
but we only obtain a dichotomous result: dead of alive, with a similar
accuracy than Briceño´s model. Their model was also superior to the
MELD, D-MELD, P-SOFT, BAR, and DRI 21 scales. Ibañez et al. [22]
developed a LR and ANN to predict transplant failure 3 months after
transplantation. They selected 19 variables from donor, recipient and
operative data and they obtained an AUC in the validation cohort
of 0.81 with ANN model, similar to our results. Our predict model
based on ANN can maintain accuracy of these models 1 year after
transplantation. To facilitate the use of our predictive model, we have
developed an application available at http://emac.uv.es/liver (Figure
4). After introducing all variables, a predictive result is obtained. This
result could facilitate decision-making to allocate available grafts
based on the expected mortality for each particular recipient.
The model based on the ANN was superior to the LR model and
other scales currently used to predict mortality during the first year
after LT and to match a particular donor with a potential recipient.
However, multicenter validation of this model is necessary before
it can be considered a valid tool for improving the efficiency of the
management of LT wait lists [12].
Figure 4
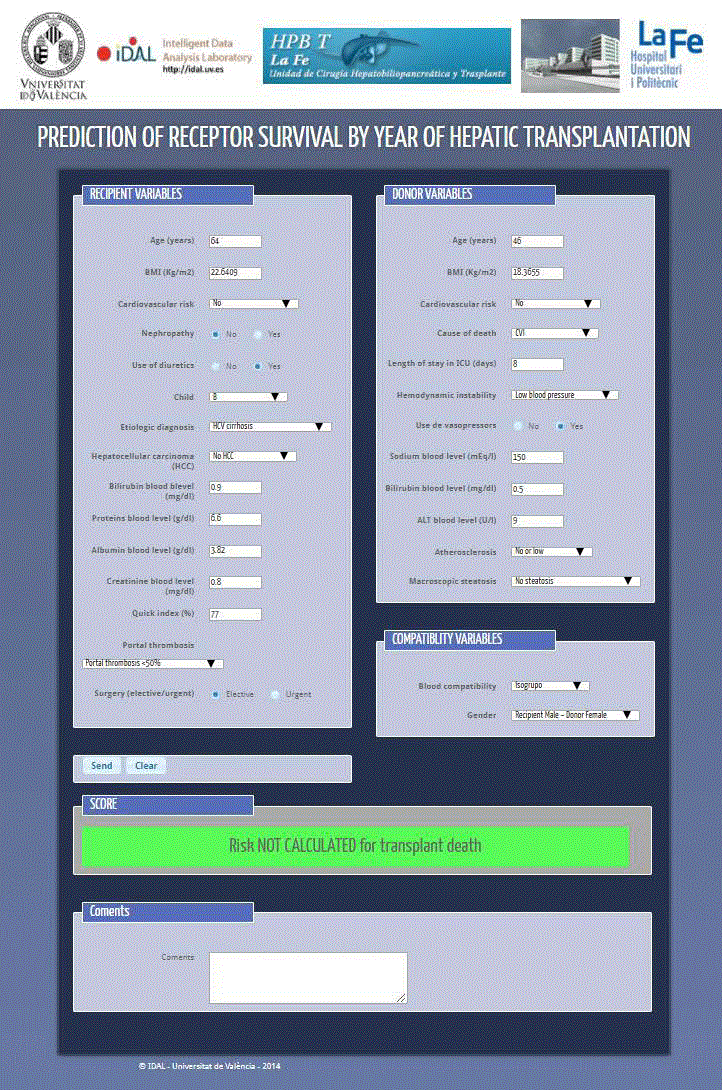
Figure 4
Web application (http://emac.uv.es/liver/index_eng.php).
References
- Schrem H, Till N, Becker T, Bektas H, Manns MP, Strassburg CP, et al. Long-term results after liver transplantation. Chirurg. 2008;79:121-9.
- Spanish Registry from Hepatic Transplantation. Results Report. 2010.
- Donation and transplant statistics.
- Marino IR. Are we ready to match donor and recipient in liver transplantation? Liver Transpl. 2006;12(11):1574-6.
- Moore DE, Feurer ID, Speroff T, Gorden DL, Wright JK, Chari RS, et al. Impact of donor, technical, and recipient risk factors on survival and quality of live after liver trasplantation. Arch Surg. 2005;140(3):273-7.
- Rivero G. In: Análisisde datos incompletos en Ciencias Sociales. Centro de Investigaciones Sociológicas. 2011;75-9.
- Hanley JA, McNeil BJ. A method of comparing the areas under receiver operating characteristic curves derived from the same cases. Radiology 1983;148(3):839-43.
- Zaman MB, Hoti E, Qasim A, Maguire D, McCormick PA, Hegarty JE, et al. MELD score as a prognostic model for listing acute liver failure patients for liver transplantation. Transplant Proc. 2006;38(7):2097-8.
- Ma Y, Wang Q, Yang J, Yan L. Comparison of different scoring systems based on both donor and recipient characteristics for predicting outcome after living donor liver transplantation. PLoS One. 2015;10(9):e0136604.
- Kim WR, Therneau TM, Benson JT, Kremers WK, Charles B, Rosen CB, et al. Deaths on the liver transplant waiting list: an analysis of competing risks. Hepatology. 2006;43(2):345-51.
- Briceño J, Ciria R, De la Mata M. Donor-recipient matching: Myths and realities. J Hepatol. 2013;58(4):811-20.
- European Liver Transplant Registry. Data analysis booklet. Paris 2007. Accessed August 2008.
- Registro español de trasplante hepático. Organización Nacional de Trasplantes. Ministerio de Sanidad y Consumo. Octava memoria de resultados. 1984-2005.
- Bilbao I, Armadans L, Lazaro JL, Hidalgo E, Castells L, Margarit C. Predictive factors for early mortality following liver transplantation. Clin Transplant. 2003;17(5):401-11.
- Adam R, Hoti E. Liver Transplantation: The Current Situation. Semin Liver Dis. 2009;29(1):3-18.
- Bruna M, López R, Montalvá E, Redondo C, Moya A, San Juan F, et al. Donantes de ayer y hoy: ¿han cambiado las características de los donantes de hígado en los últimos 15 años? Cir Esp. 2008;83:192-6.
- US Scientific Registry (UNOS). Richmond (VA): United Network for Organ Sharing. Accessed February 12, 2006.
- Adam R, Cailliez V, Majno P, Karam V, McMaster P, Caine RY, et al. Normalised intrinsic mortality risk in liver transplantation; European liver Transplant Registry Study. Lancet. 2000;356(9230):621-7.
- Schrem H, Till N, Becker T, Bektas H, Manns MP, Strassburg CP. Long-term results after liver transplantation. Chirurg. 2008;79:121-9.
- Schumacher M, Robner R, Vach W. In: Neural networks and logistic regression: Part I. Computational Statistics & Data Analysis. 1996;21:661-82.
- Briceño J, Cruz-Ramírez M, Prieto M, Navasa M, Ortiz de Urbina J, Orti R, et al. Use of artificial intelligence as an innovative donor-recipient matching model for liver transplantation: results from a multicenter Spanish study. J Hepatol. 2014;61(5):1020-8.
- Ibáñez V, Pareja E, Serrano AJ, Vila JJ, Pérez S, Martín JD, et al. Predicting early transplant failure: neural network versus logistic regression models. Open Transplant J. 2009;3:14-21.